ROLE
TIMELINE
TOOLS
Design 6 weeks
UX Researcher, UI Designer
Led end-to-end design, simplifying complex information and ensuring accurate implementation.
Alfa Upgrades
Design: Figma, Canva, Adobe Photoshop, Adobe illustrator
Develop: Webflow
Develop 3 weeks


Alfa Upgrades had a breakthrough pipeline protection product Geobuffer —but only research papers, AutoCAD files, and dense diagrams to explain it. I redesigned their site to make the technology clear and credible to engineers, safety managers, and decision-makers in oil & gas.
Alfa Upgrades
This project focused on redesigning the ALFA Upgrades website to simplify complex engineering content and make it more accessible to technical audiences.
The platform introduces Geobuffer, an innovative pipeline protection technology, but its complexity made it difficult for users to quickly understand its value.
I improved content structure, visual hierarchy, and navigation clarity to translate technical information into a more intuitive and user-friendly experience.
Making a complex pipeline technology understandable in one scroll.
PROJECT OVERVIEW
Goal


Audience
Simplify complex pipeline protection concepts and make them clear and engaging for industry professionals.
Pipeline engineers, safety managers, and decision makers in the oil & gas industry.
A clearer and more accessible platform that helps users quickly understand the technology and its value.
Impact

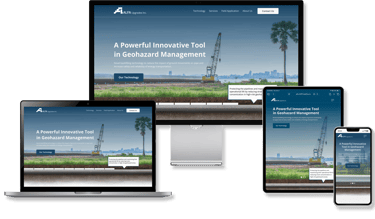
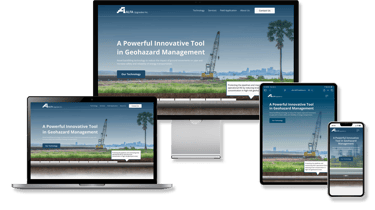
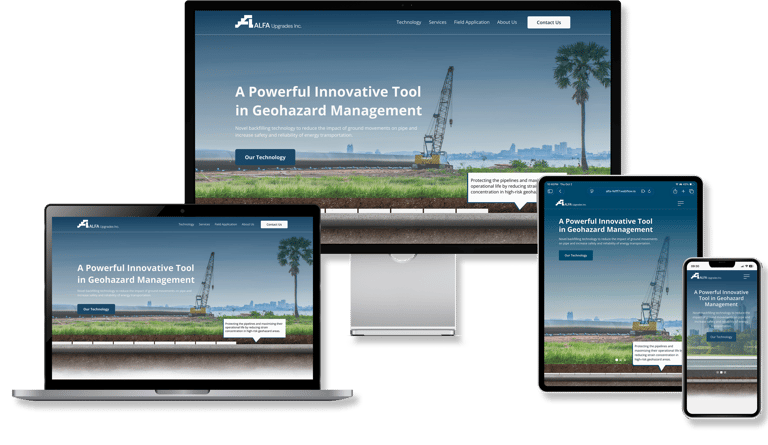
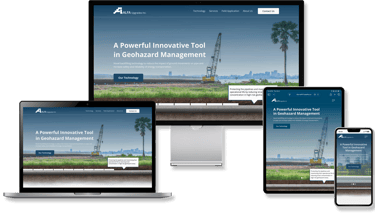
Final Experience
Simplifying Complex Workflows for Technical Experts
Where We Started
When Alfa approached us, they had a powerful new product but no clear way to communicate it online.
Their content was highly technical filled with research papers, AutoCAD files, and complex diagrams making it difficult for users to quickly understand the value of the technology.
The challenge was to simplify and structure this information without losing technical credibility.
WHAT IS THE PROBLEM?
Making Complex Information Understandable
The main challenge was balancing technical depth with usability. The platform needed to communicate complex information clearly, while remaining credible for expert users.
This required rethinking content structure, visual hierarchy, and how information is presented to reduce cognitive load.
THE CHALLENGE


The Core Problem
Dense Technical Content
Lack of clear visual system beyond technical diagrams
No Visual Identity
Highly complex materials that overwhelmed users
Expert Audience
Needed to remain credible while improving accessibility
Main Problems & Solutions
DESIGN STRATEGY
I broke an overwhelming brief into three solvable problems.
Rather than treating “make it simpler” as a vague objective, I identified three specific usability challenges and addressed each one individually.
1
Organizing Complex Information
ALFA’s technical documentation was comprehensive but difficult to navigate. Users struggled to move from high-level concepts to detailed technical information.
To address this, I structured content using progressive disclosure, guiding users from high level overviews to detailed technical information.
2
3
Making a Complex System Understandable
Geobuffer involves complex engineering concepts that were difficult to explain without context, making it hard for users to understand how the system works.
To address this, I collaborated with engineers to translate complex AutoCAD diagrams into clear, annotated visuals, using storytelling to make technical concepts easier to understand.
Building a Visual System from Scratch
ALFA lacked visual assets such as product imagery or marketing materials, making it difficult to present the technology in a clear and engaging way.
To solve this, I created a visual system using custom icons, data visualizations, and a refined color palette to communicate clarity while maintaining technical credibility.


Main Problems:


#1 Organizing Dense Information Without Overwhelming Users
#2 Making a Complex System Understandable
#3 Visualizing a Technology With No Visual Assets
DESIGN STRATEGY
Breaking Down the Complexity
We identified three critical problems that needed solving to create an effective digital experience.
1
Organizing Dense Information Without Overwhelming Users
ALFA's technical documentation was comprehensive but inaccessible. We needed to create an information hierarchy that would guide users from high level value propositions to detailed technical specifications.
Solutions:
Implemented a layered content structure with progressive disclosure allowing users to dive deeper based on their expertise level and interest. Created clear navigation pathways from overview to technical details.
2
3
Making a Complex System Understandable
Geobuffer technology involves subsurface engineering, pipeline protection, and geotechnical analysis concepts that are difficult to visualize and explain without proper context.
Solutions:
Collaborated with engineers to convert complex AutoCAD diagrams into clear, annotated visuals and used storytelling to translate technical concepts into real-world value.
Visualizing a Technology With no Visual Assets
Unlike consumer products, ALFA didn't have product photography, lifestyle images, or marketing materials. We had to build a visual language from scratch that conveyed professionalism and technical sophistication.
Solutions:
Created a visual system using industry-appropriate photography, custom icons, and data visualizations, with a color palette and typography that balance technical credibility and modern web standards.


Problem #1 Organizing Complex Information
Structuring Information Through Research and Insights
COMPETITOR RESEARCH INSIGHT
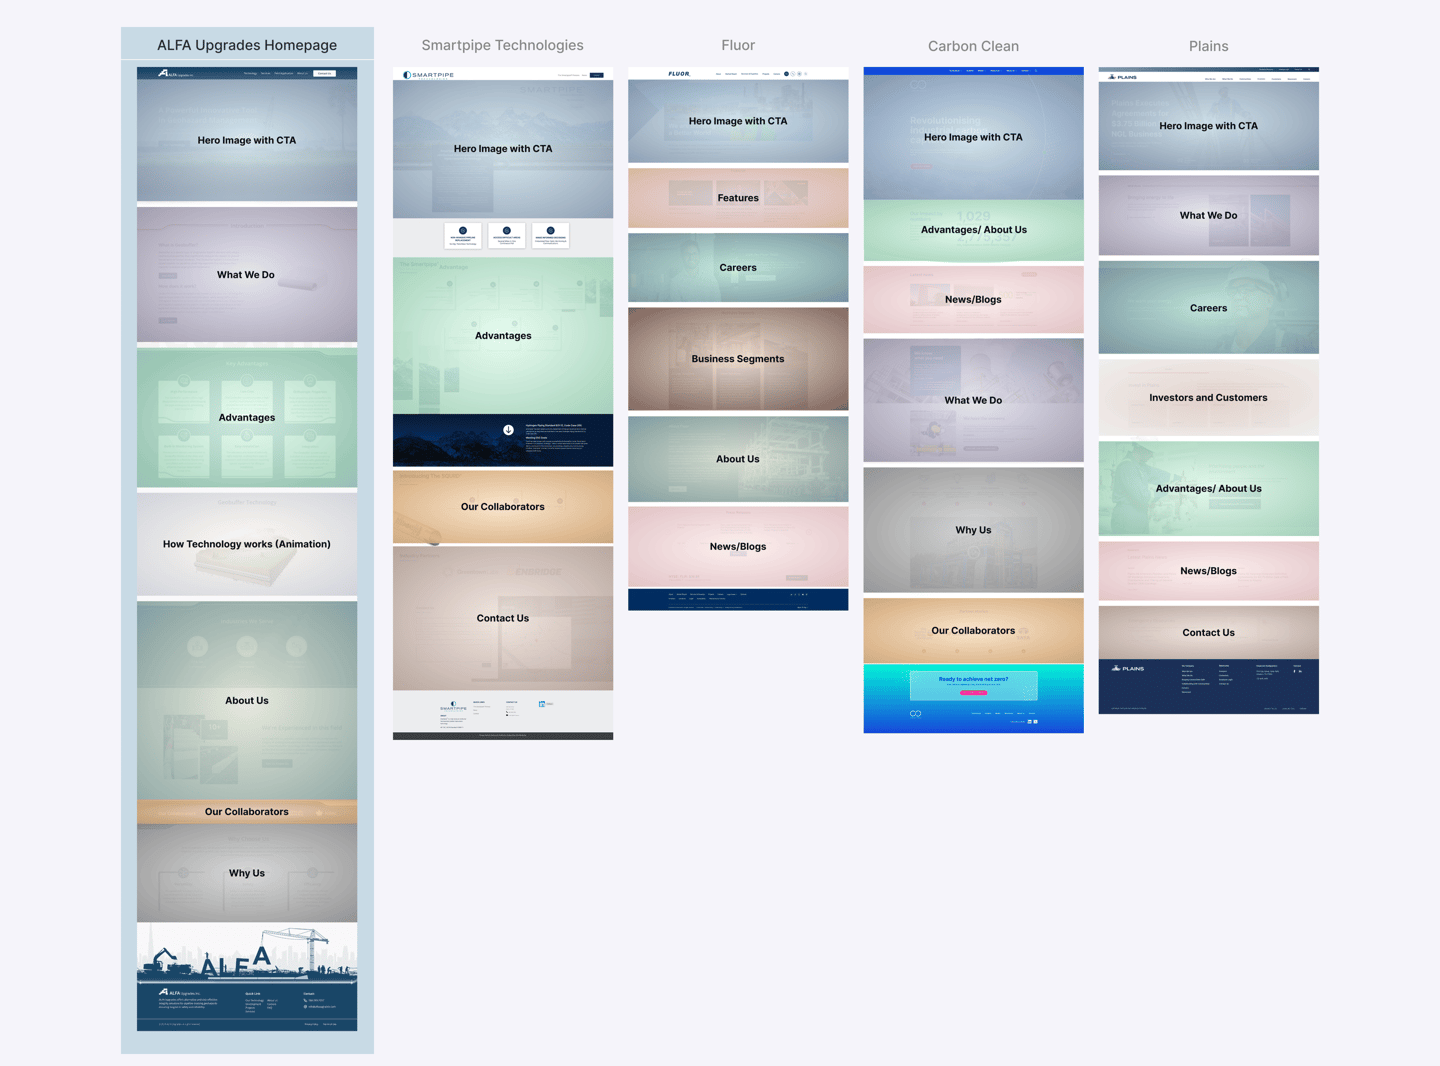
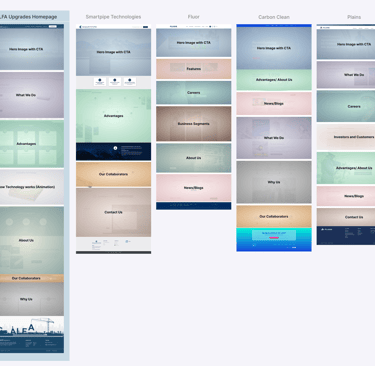
Using Competitive Analysis to Structure Navigation
To design a platform without an existing structure, I conducted a competitive analysis to understand how similar companies organize complex information.
This revealed common patterns in navigation and content hierarchy, which helped shape a clearer and more structured information architecture.
Approach
Key Insight
I analyzed how similar companies structure their websites, focusing on homepage hierarchy and key offerings.
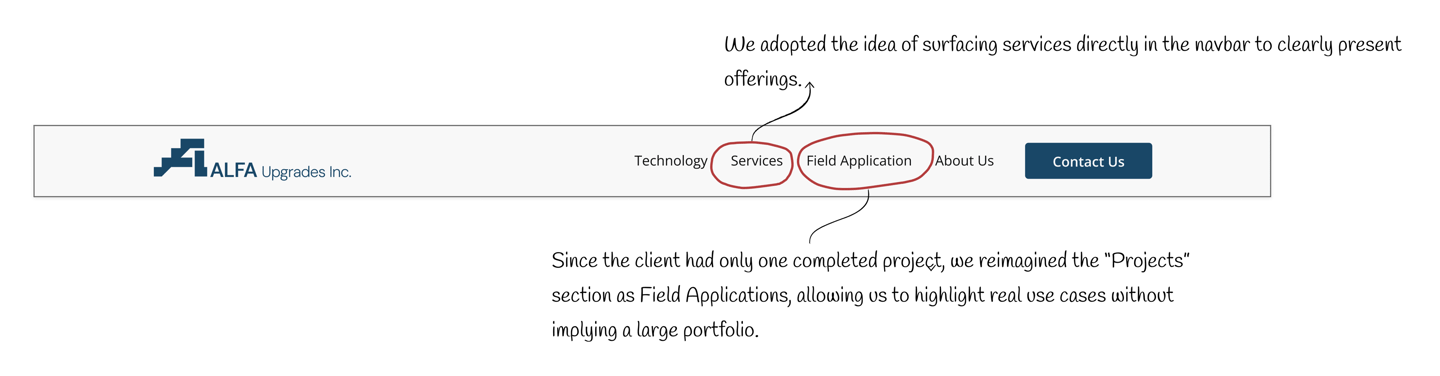
This helped define clear content sections such as “What We Do”, “Technology”, and “Collaborators”, while highlighting the uniqueness of the Geobuffer system.
Segmented Evaluation
We analyzed navigation, technical content, and visibility of services and case studies. This guided our navbar design, highlighting key pages like 'Technology' and 'Projects' early to build trust and improve findability.


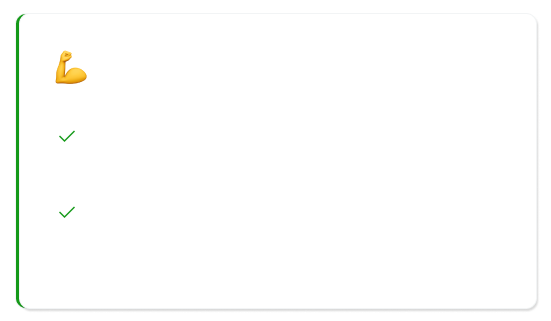
Strengths Across Competitors


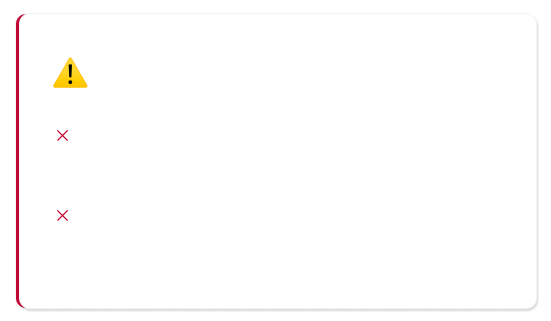
Common Gaps and Weaknesses
Putting Services in the top navigation made it easier for users to find.
Showing Projects/Case Studies built trust by highlighting real work.
Some competitors hid service details too deep in the site, making it hard for users to find.
Segmented Evaluation
I analyzed how competitors structure navigation, present technical content, and highlight key services and case studies. This revealed which content should be surfaced early to improve findability and build user trust.
Strengths Across Competitors

Common Gaps and Weaknesses
Putting services in the top navigation made it easier for users to find.
Some competitors hid service details too deep in the site, making it hard for users to find.
Showing projects/case Studies built trust by highlighting real work.
Lack of clear visual hierarchy led to overwhelming homepages with too much competing information


Research-Driven Design Decisions
These insights directly shaped the information architecture of the ALFA website.
By prioritizing key content and improving hierarchy, the design balances clarity, credibility, and usability.

How Research Shaped the Navigation


Key Insight
These insights led to a navigation structure that prioritizes clarity, surfaces key content early, and aligns with user expectations.
The result is a system that feels familiar to industry users while accurately reflecting ALFA’s current capabilities.
WIREFRAMING
Refining UX Through Iteration and Stakeholder Feedback
After defining the initial information architecture, I developed mid-fidelity wireframes and collaborated closely with stakeholders to validate content accuracy.
Due to the complexity of the subject, this process involved multiple rounds of review and refinement before moving into usability testing.
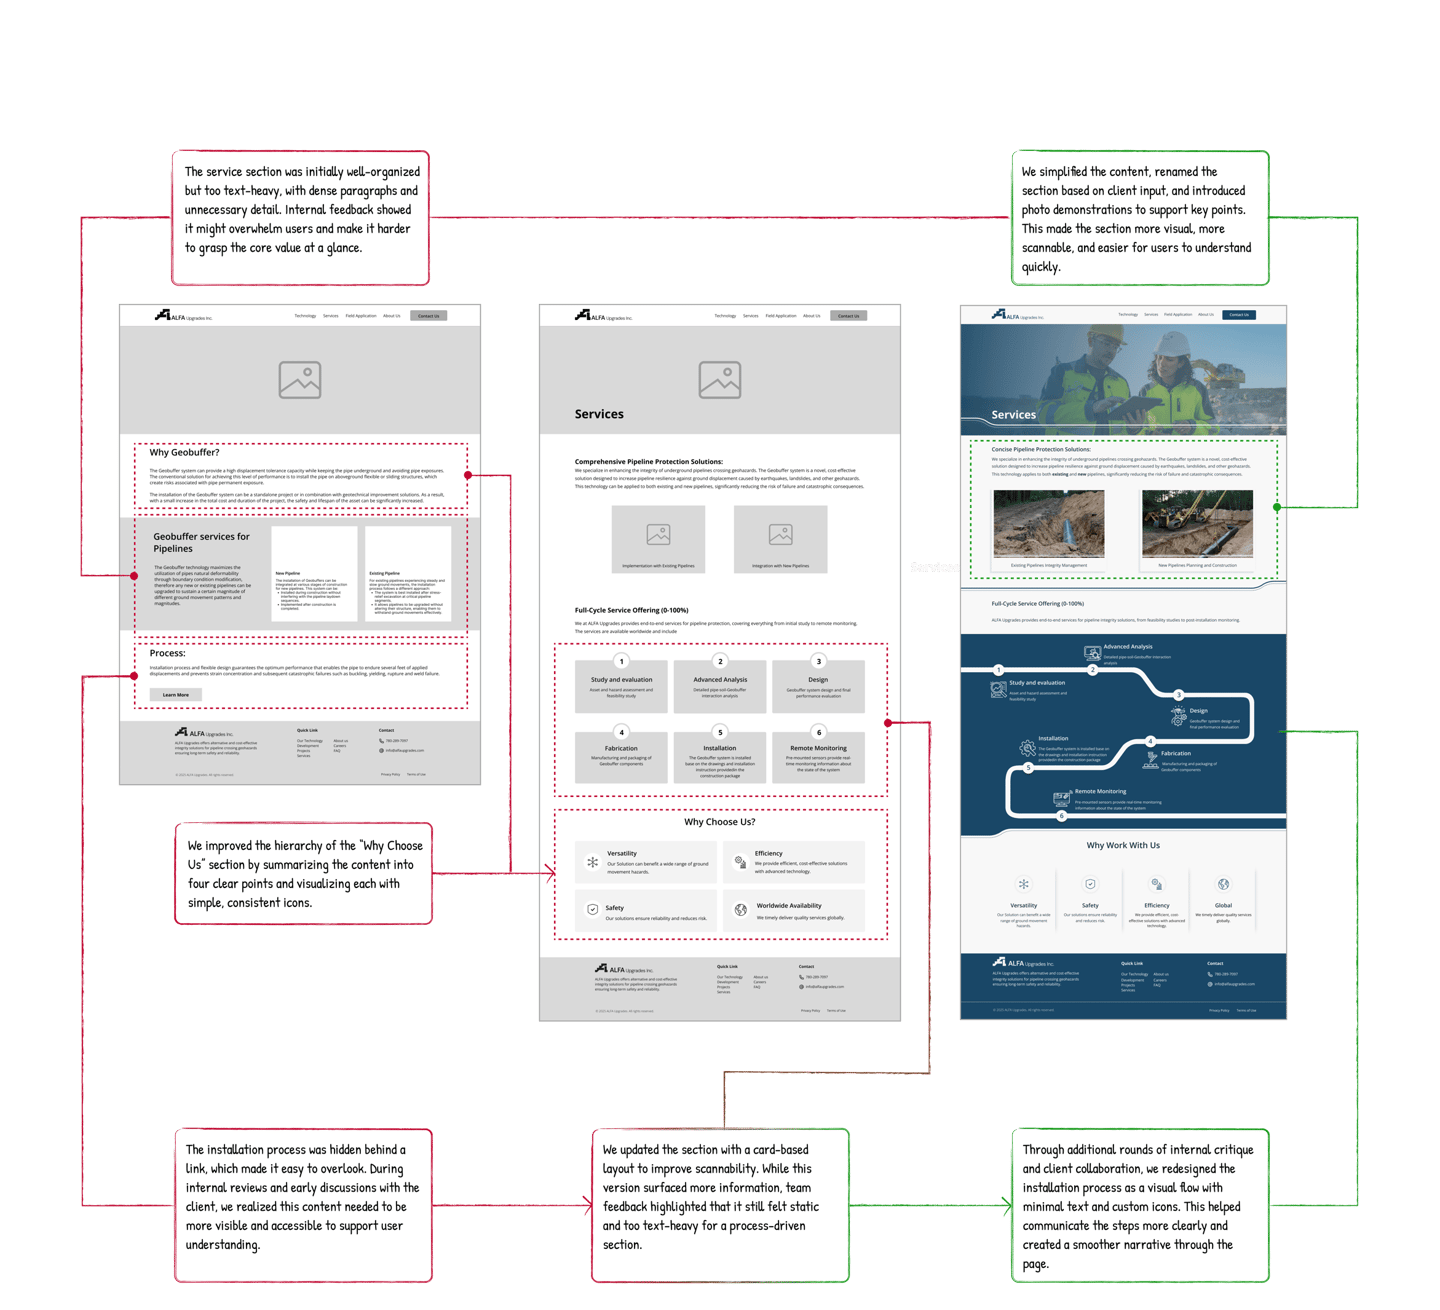
Refining Service page:
USABILITY TESTING
Validating the Design Through Usability Testing
We conducted multiple rounds of usability testing with target users, including engineers and technical professionals.
These sessions revealed key usability issues and guided several iterations, helping us refine the structure into a more intuitive and user-friendly experience.
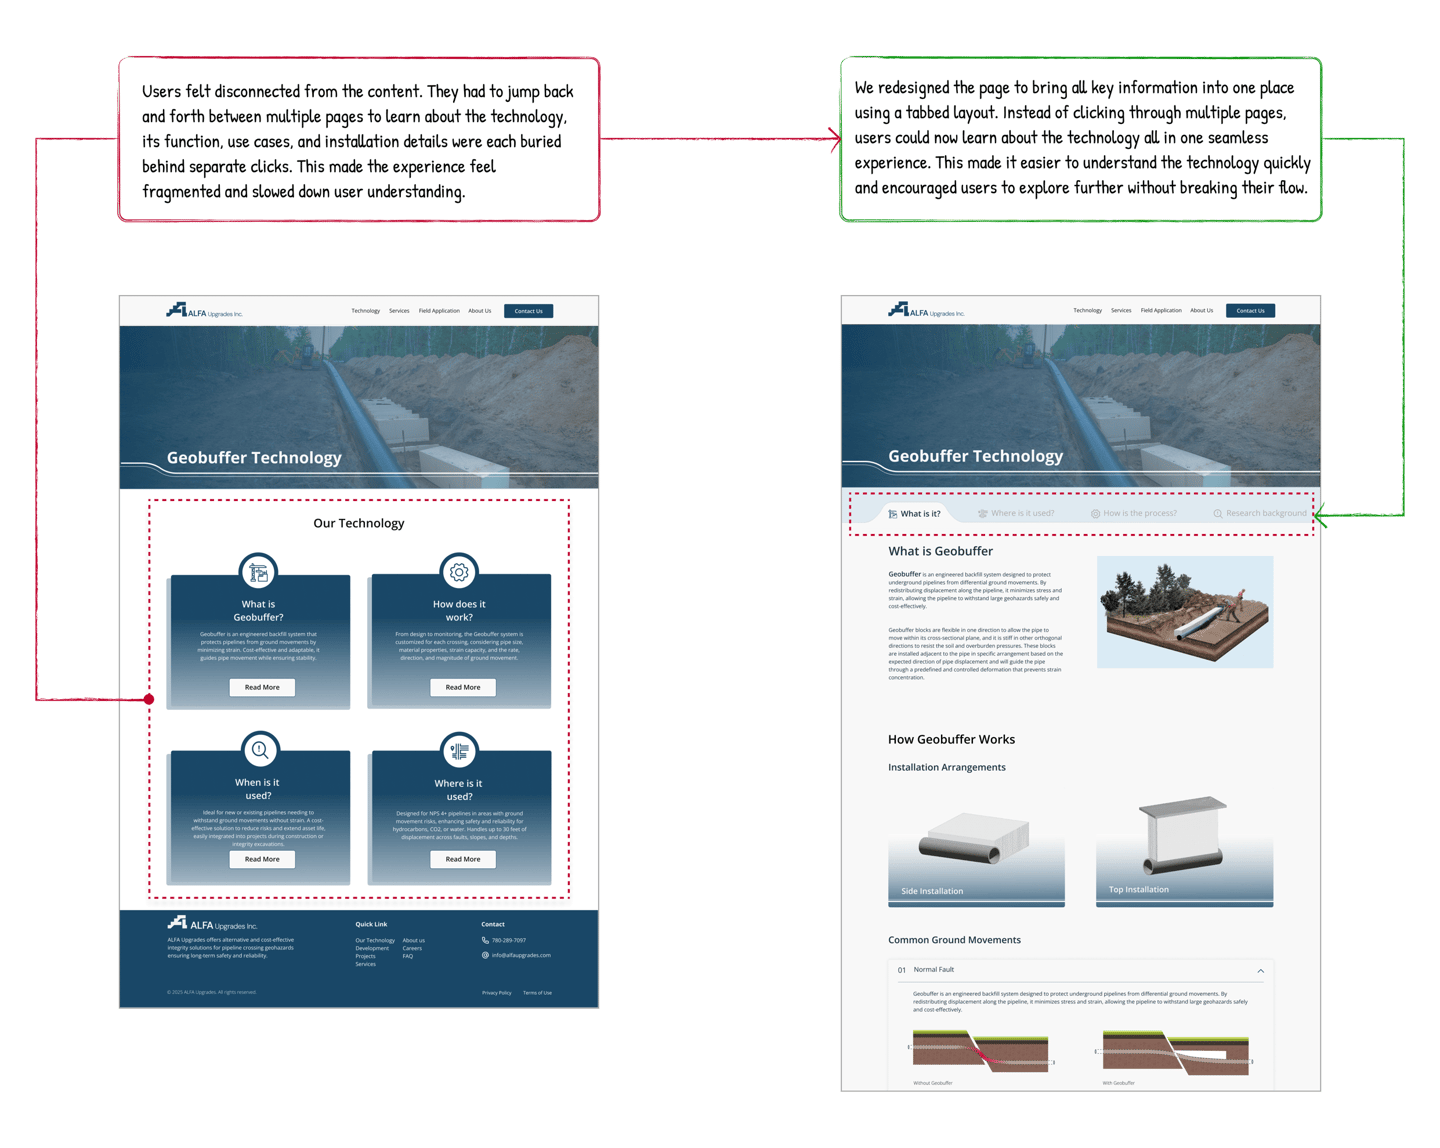
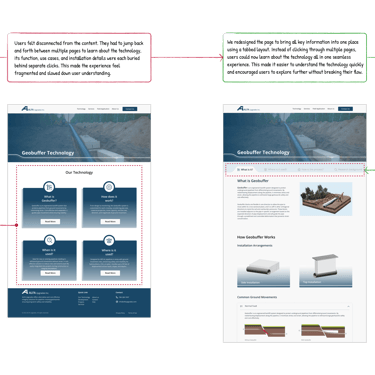

Solution: Consolidation Information
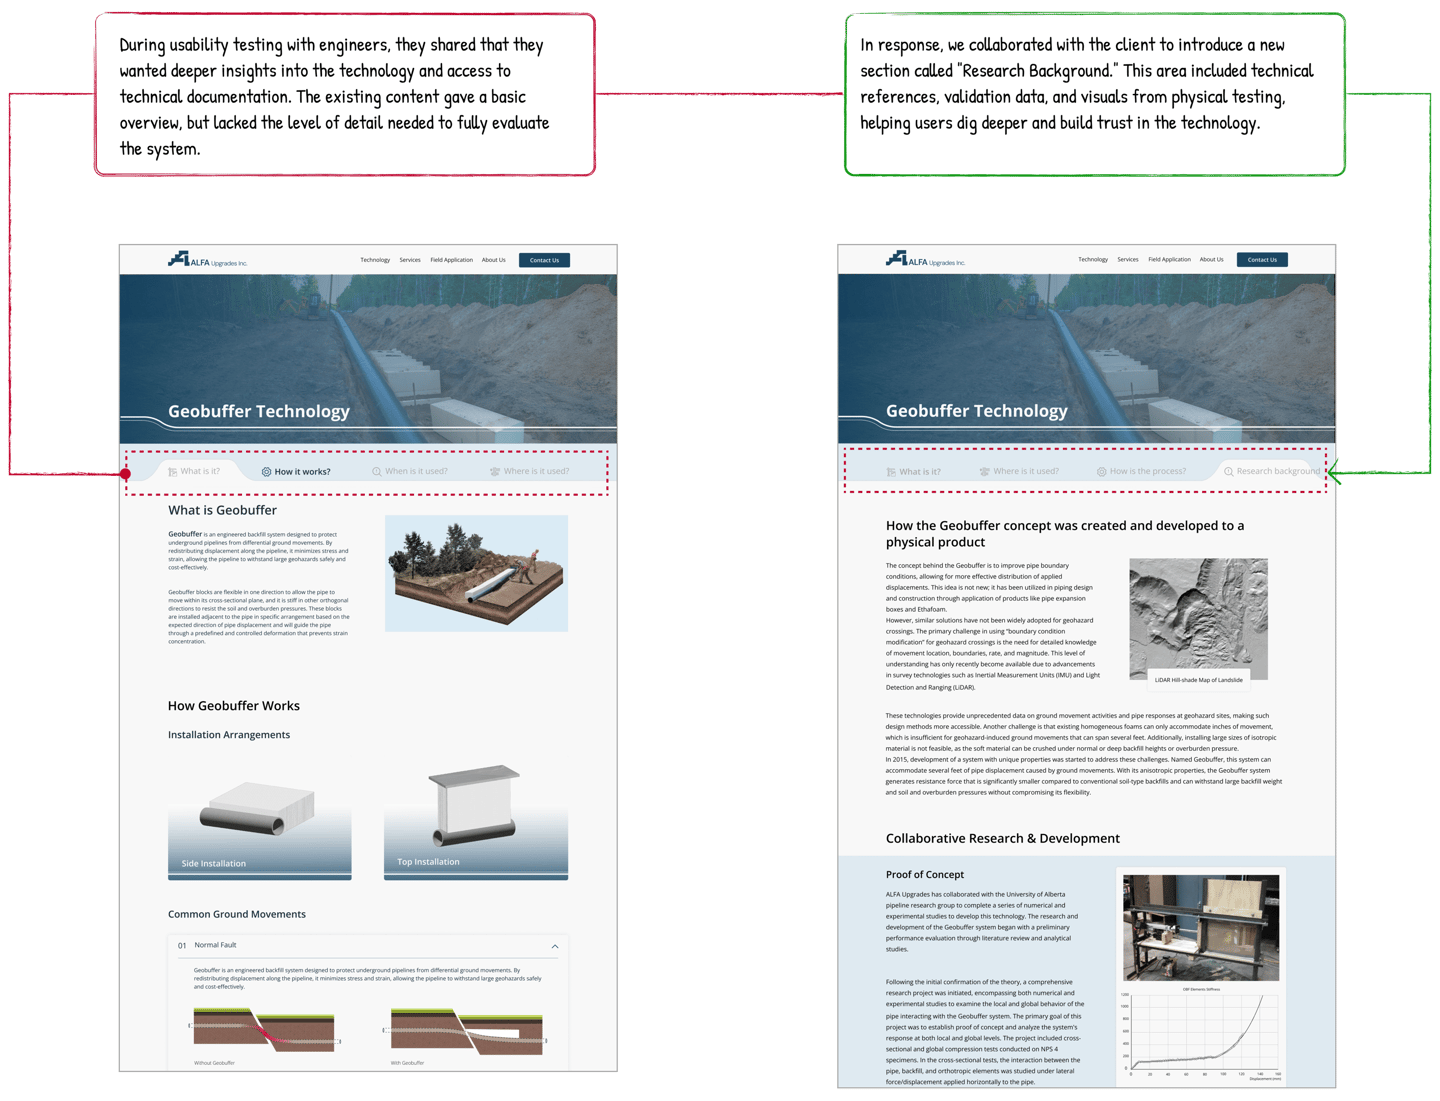
Engineers Wanted Depth
Research Background Section
User Feedback: Fragmented Experience


Validation Through Real Users
Usability testing helped validate key design decisions and uncover usability gaps early.
By testing with engineers and industry professionals, we ensured the experience was not only visually clear, but functionally effective for real users.
Real User Feedback
Engineers and industry professionals provided insights that shaped critical design decisions
Iterative Refinement
User Approved Design
Multiple rounds of testing allowed us to progressively improve the information architecture
Final designs were validated by the target audience before development


Problem #2 Making a Complex System Understandable
Making Complex Technology Instantly Understandable
VISUAL DESIGN
Process
Even with a clear structure, users still struggled to understand the technology itself.
To address this, I focused on simplifying how the system is communicated — not just how it is organized.
I used visual storytelling to translate complex concepts into clear, engaging experiences. This included an interactive hero, custom icons, and lightweight animations to guide users and explain how the system works.
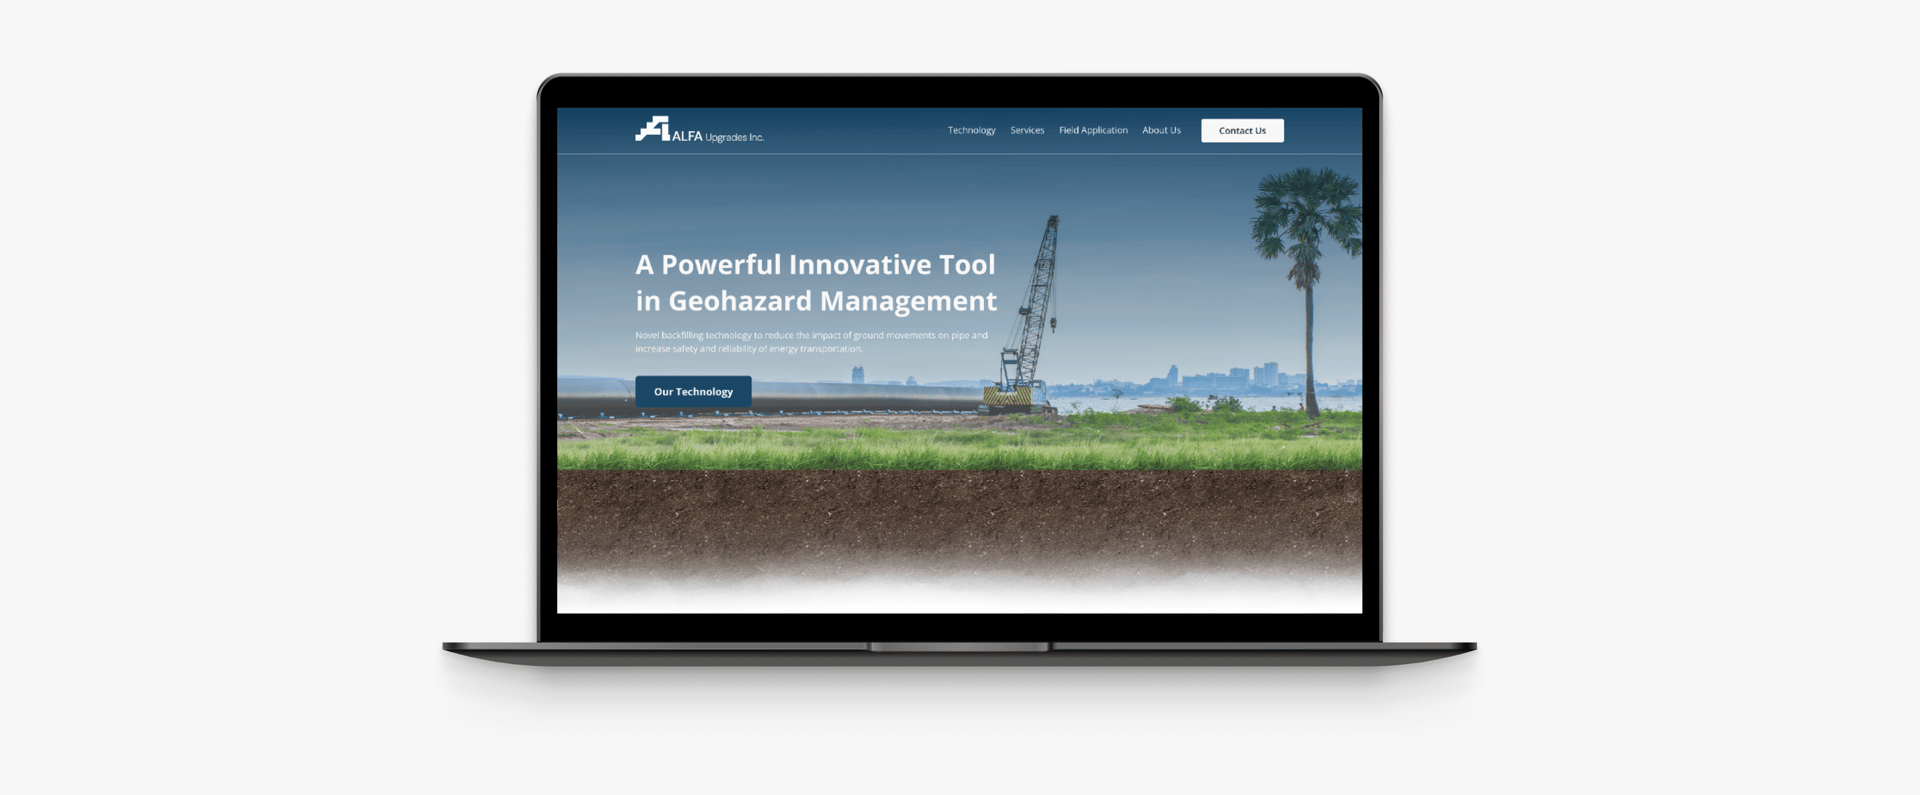
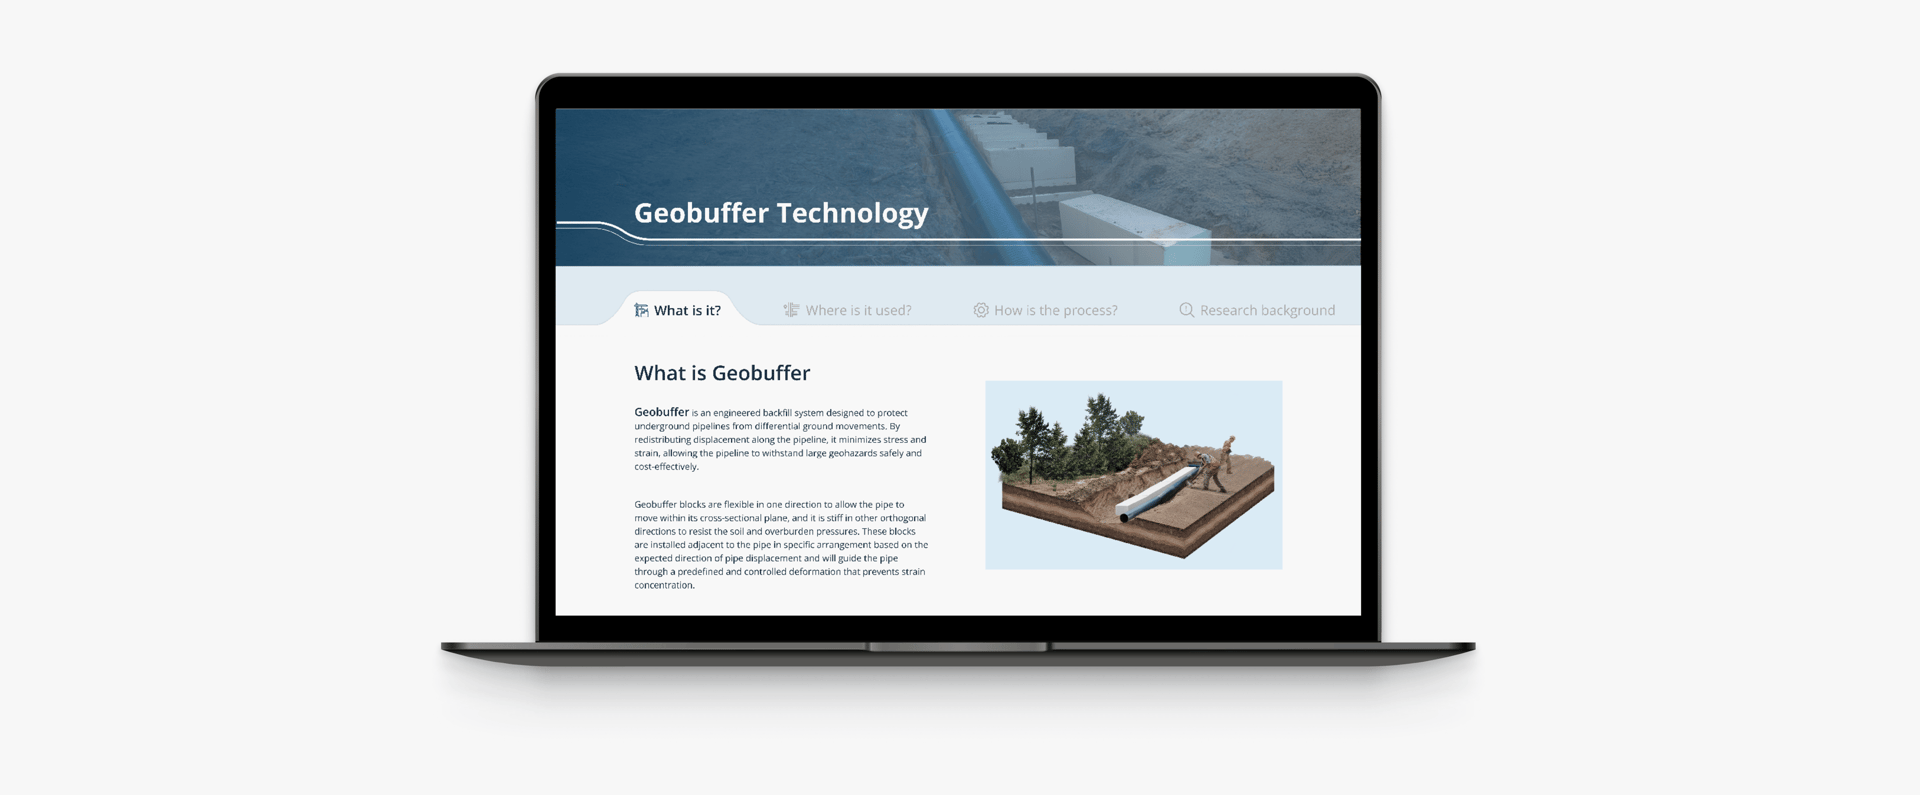
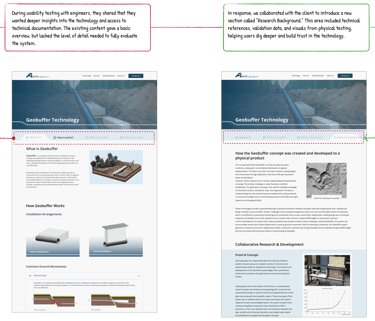
Hero Section Highlighting Technology and Versatility
We designed a dynamic hero section to communicate the system at a glance.
While the underground pipeline remains constant, the surface visuals change to demonstrate real world applications. This helps users quickly understand how the technology works across different scenarios.
To reinforce clarity and credibility, we added a concise supporting text alongside the pipeline, helping users quickly understand the technology from the first glance.
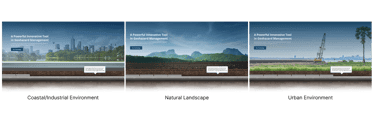


This reduced cognitive load and helped users understand the system without needing deep technical knowledge.
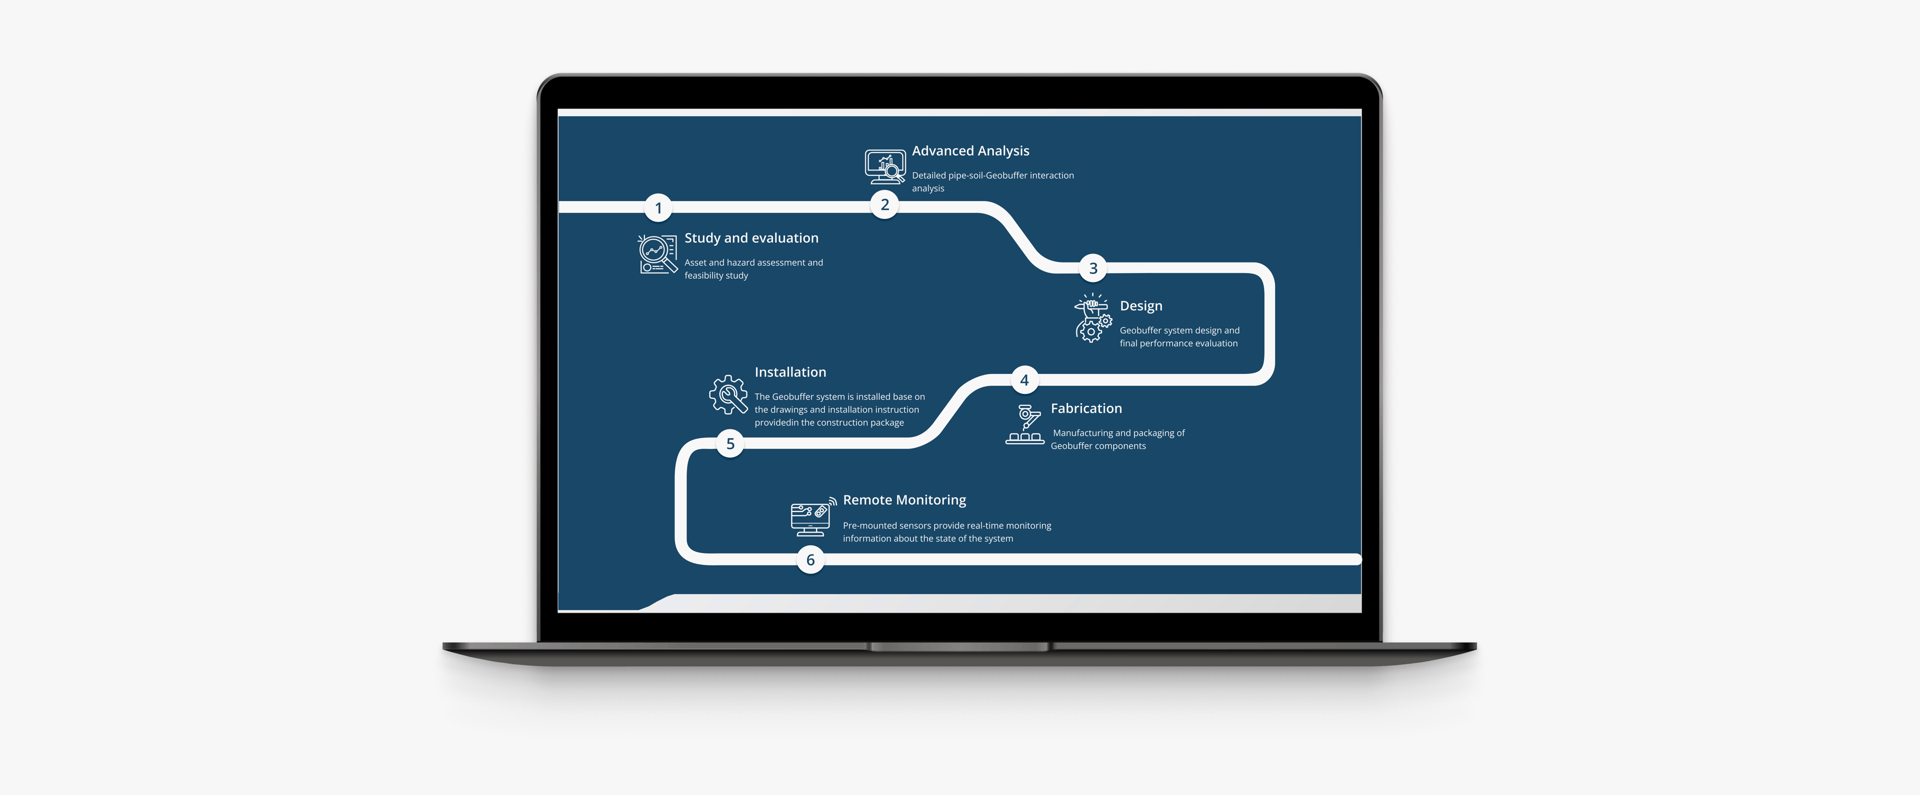
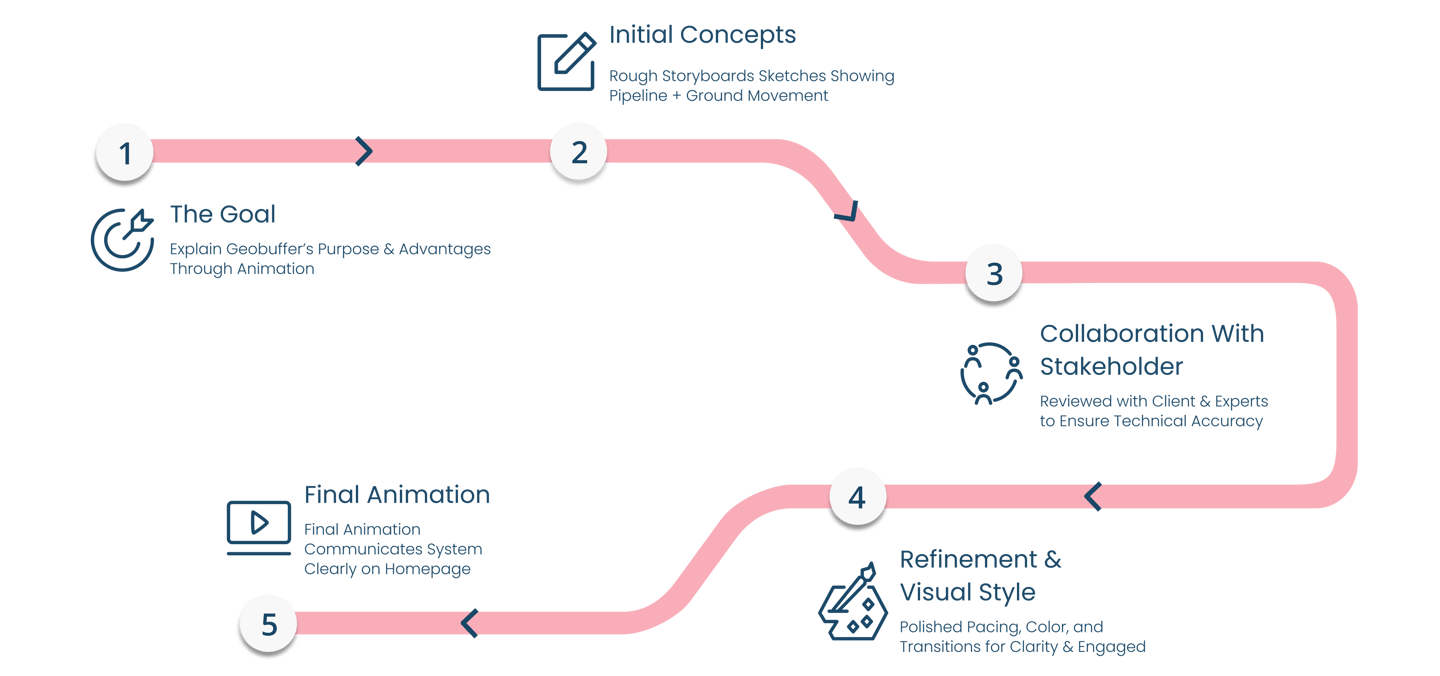
Making the Technology Understandable Through Animation
Our goal was to help users quickly understand how the technology works in a clear, engaging, and visually intuitive way.
To achieve this, we designed an animation that transforms complex processes into an easy-to-follow visual story, highlighting the system’s core functionality and real-world applications.
To further support clarity across the site:
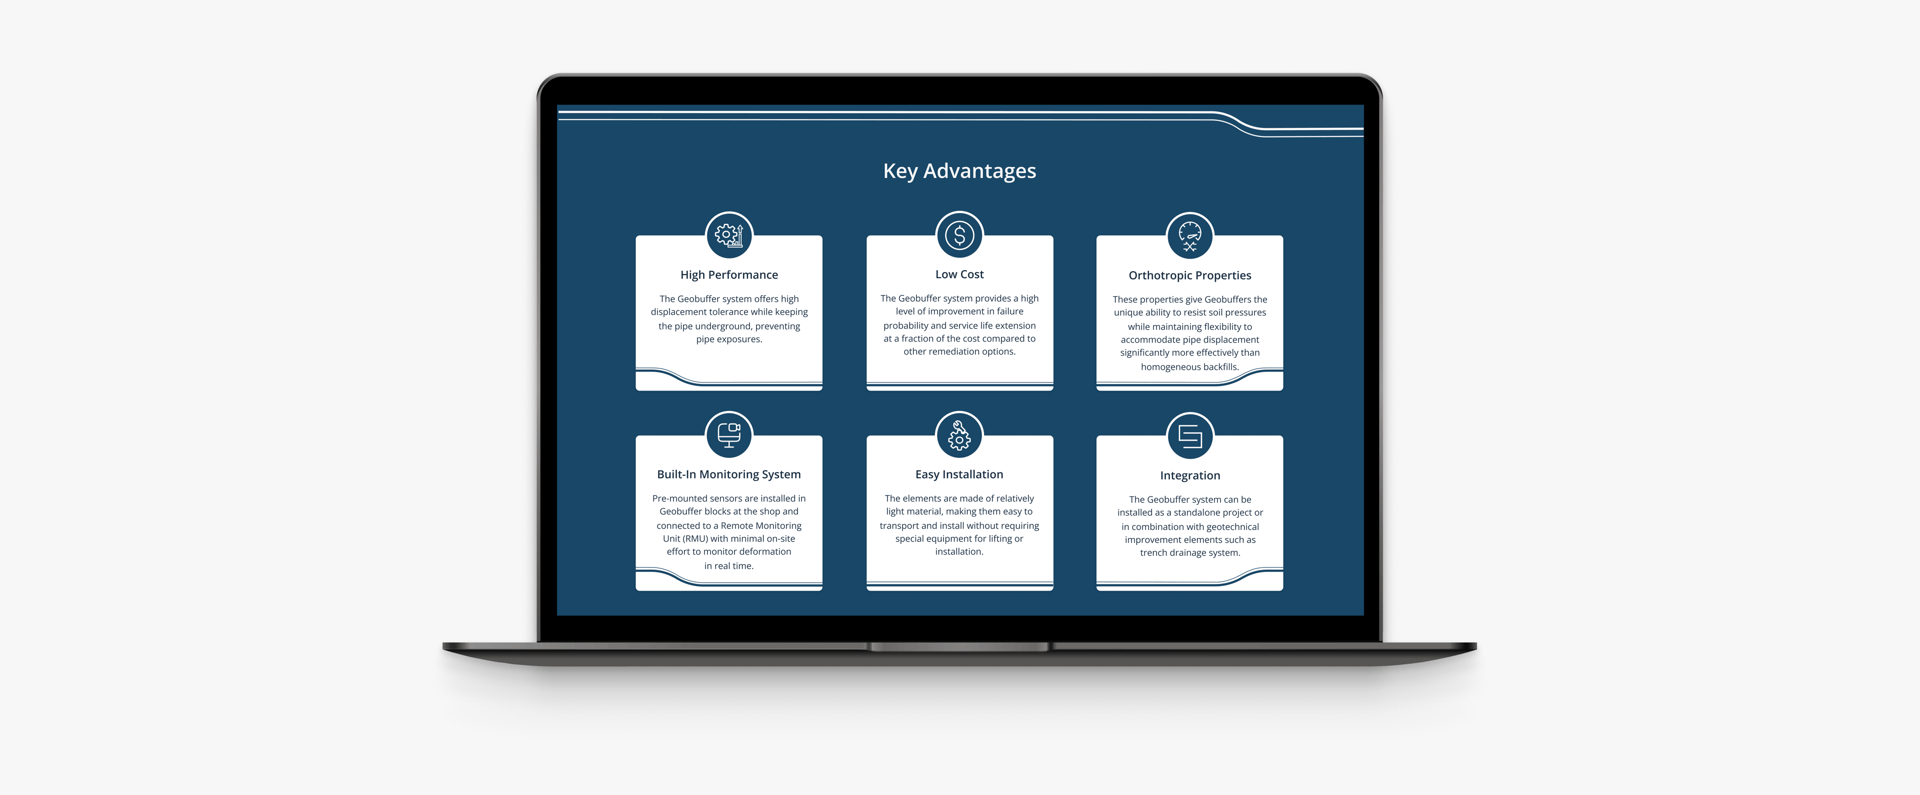
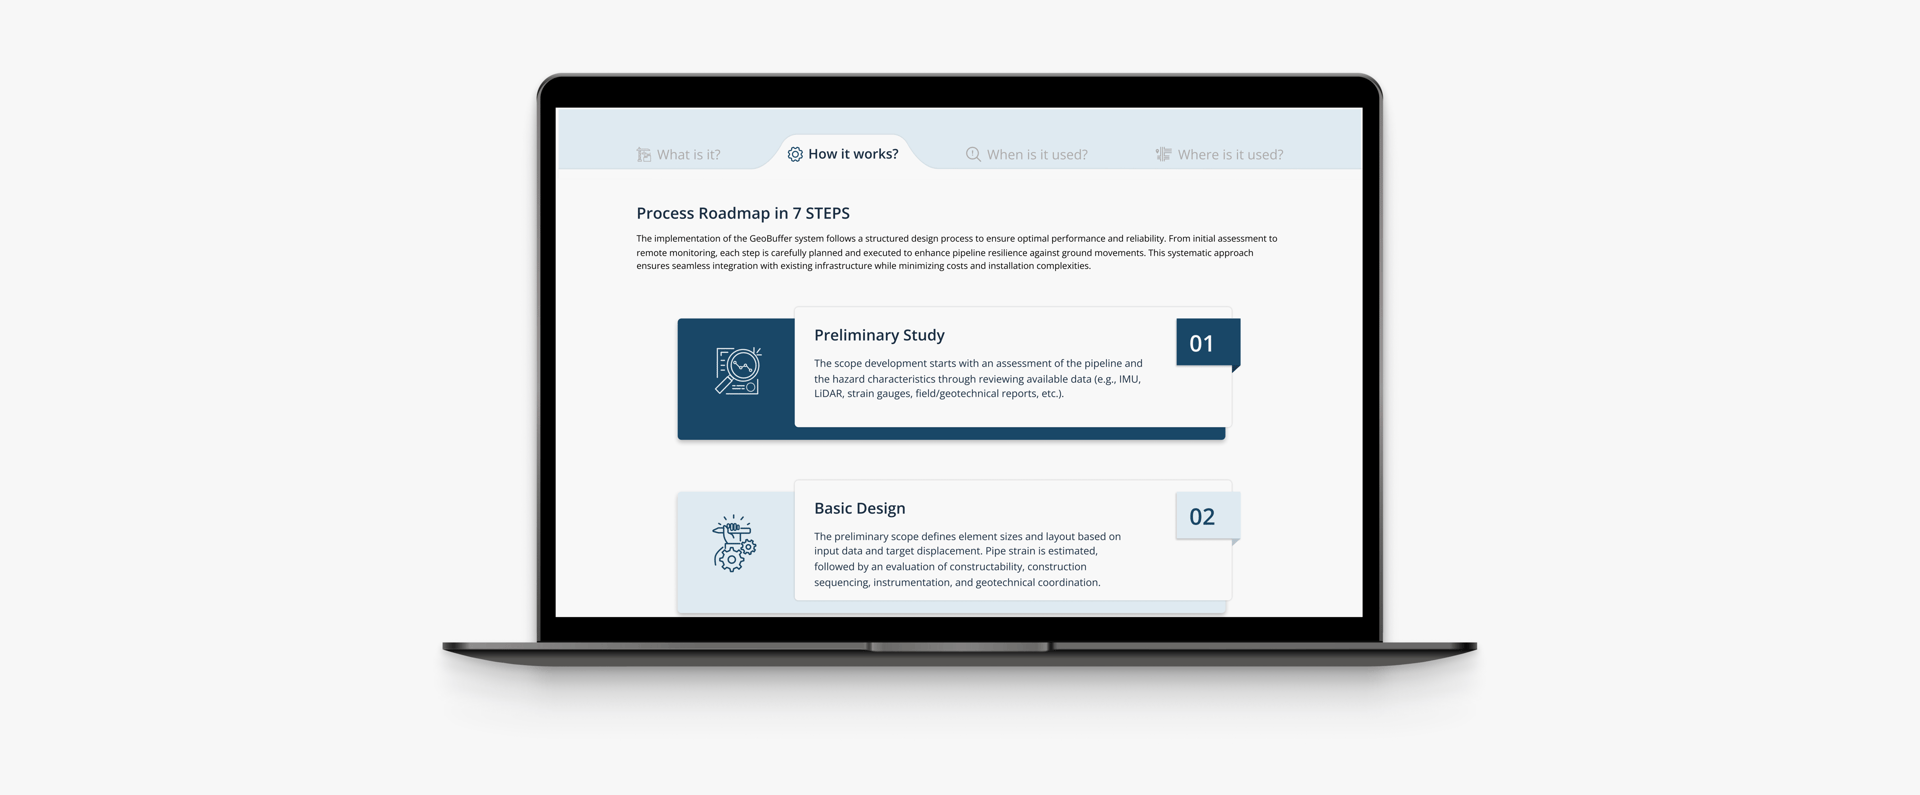
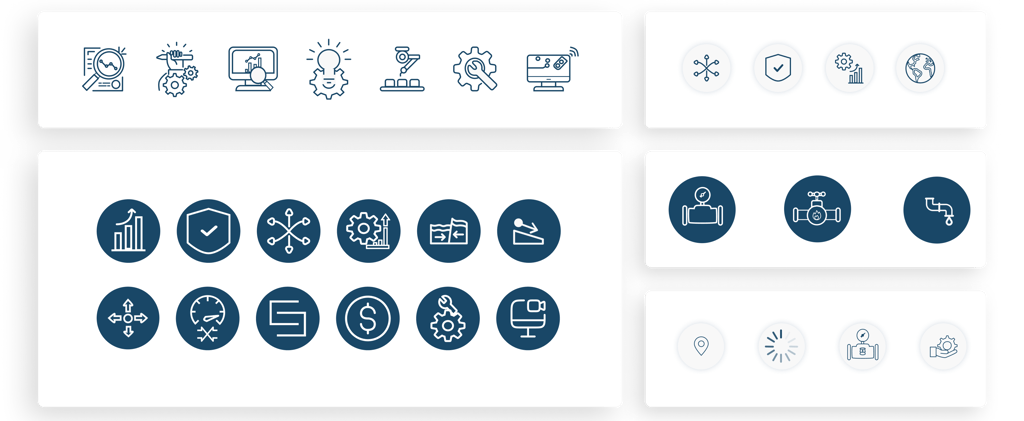
Using Custom Icons to Improve Scannability
To improve scannability and reduce cognitive load, we designed a set of custom icons tailored to each section.
Rather than serving as decorative elements, these icons acted as visual cues, helping users quickly identify and interpret key information especially in dense, technical content.
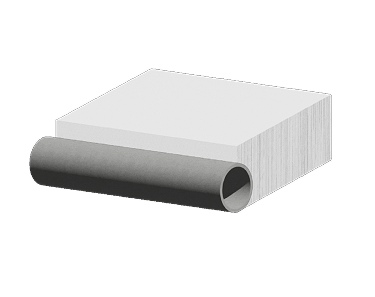
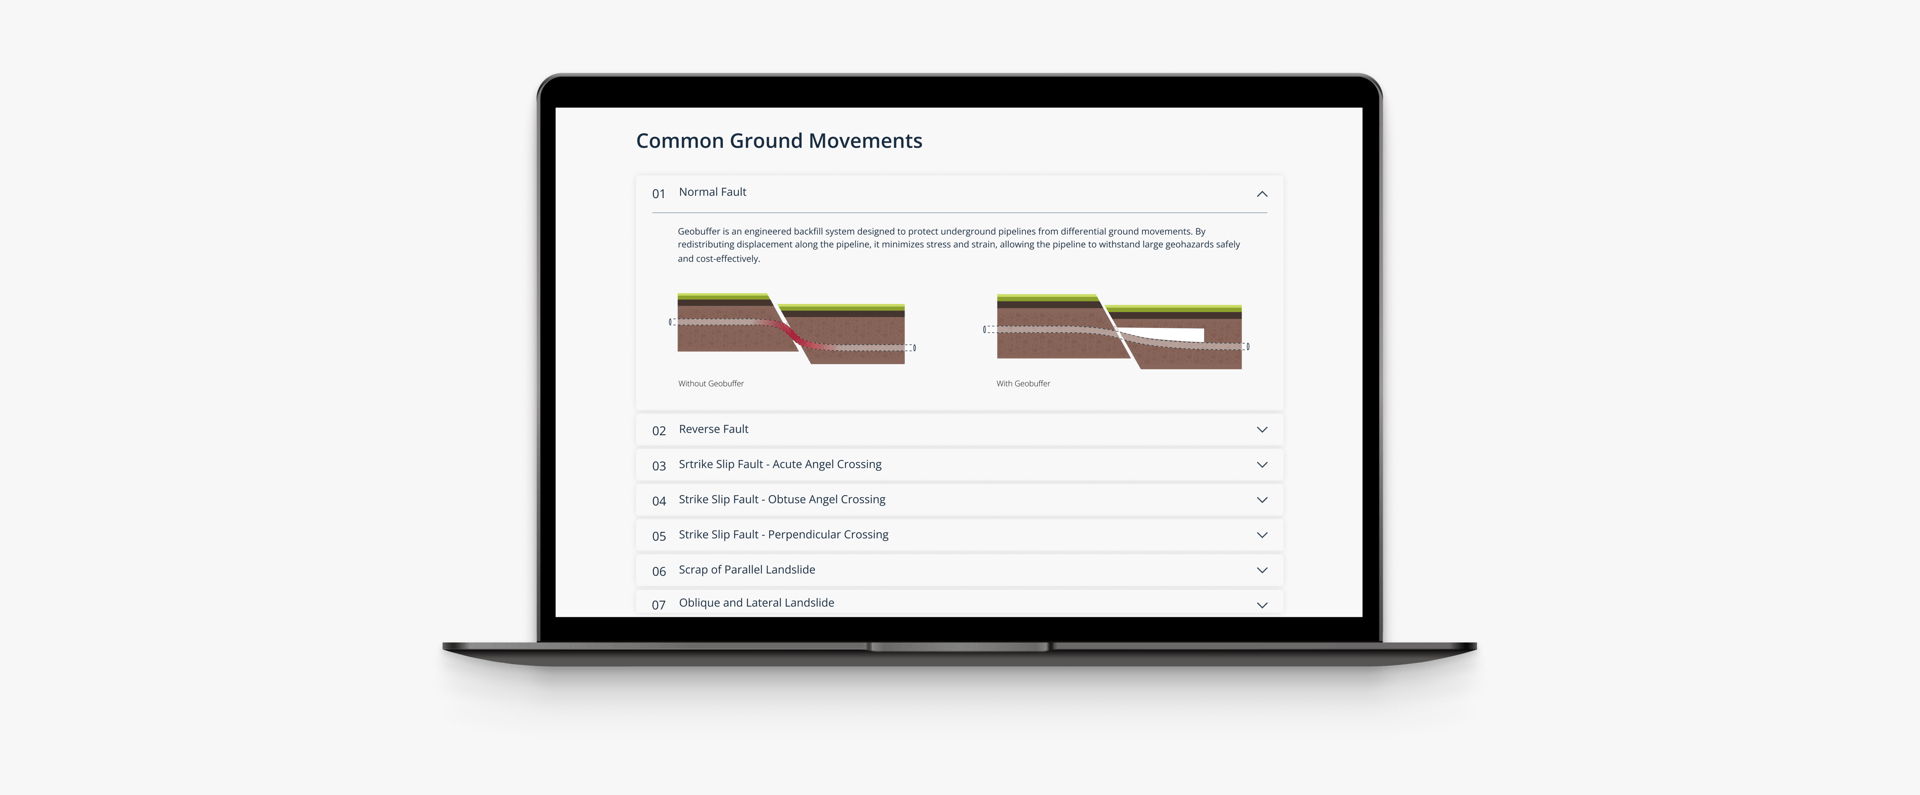
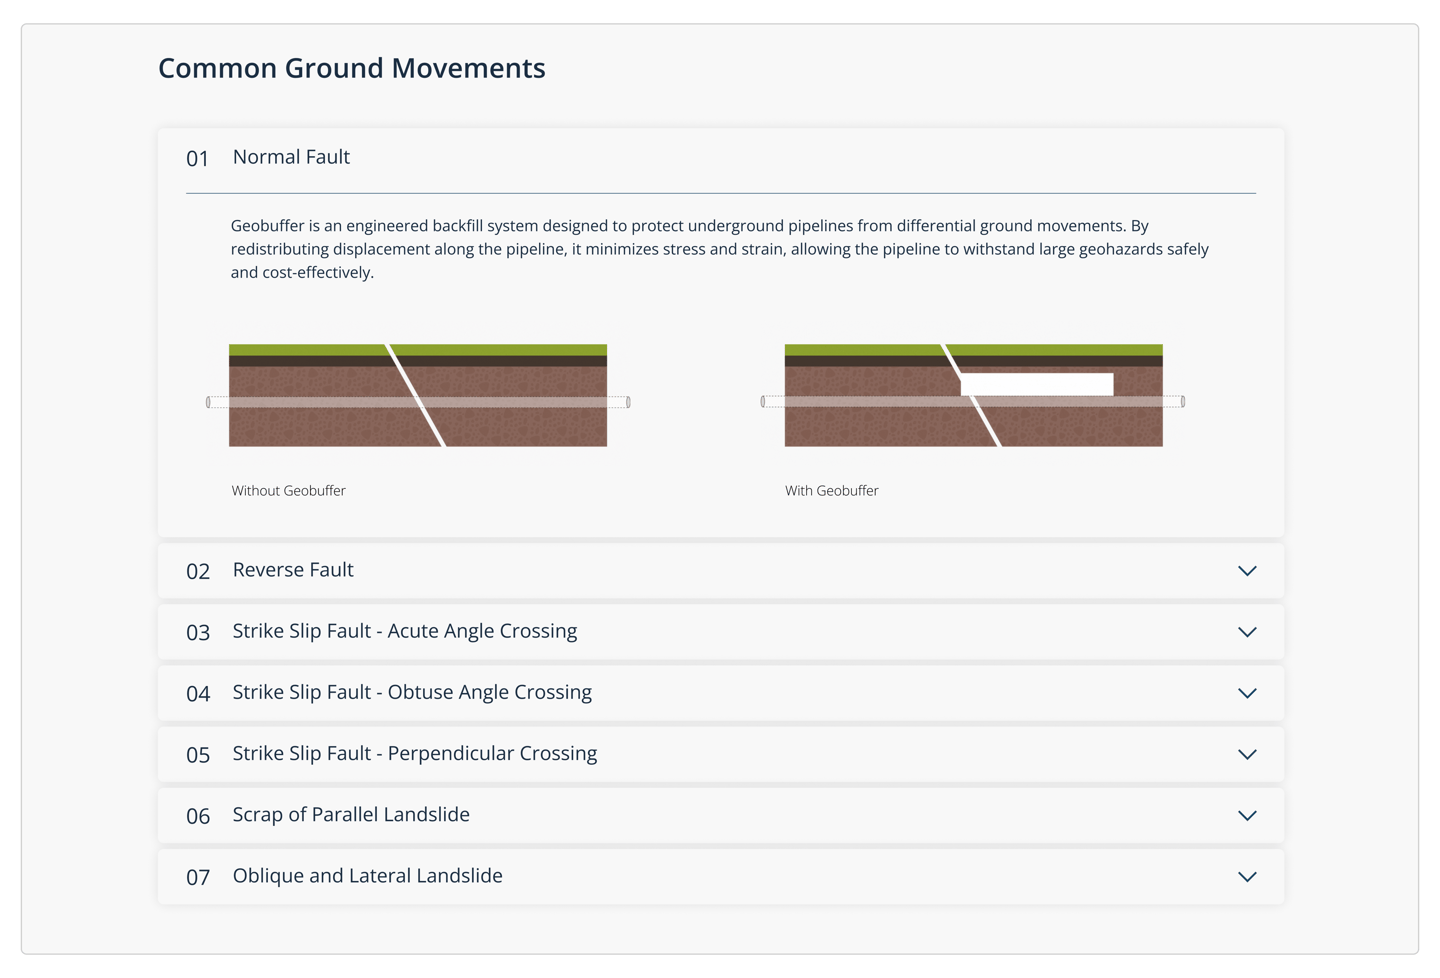
GIFs to Explain Technology
To clearly demonstrate how Geobuffer performs under different ground movements, we transformed static AutoCAD drawings into animated GIFs. These visuals illustrated scenarios like lateral shifts and vertical displacement, allowing users to quickly understand complex interactions without relying on dense technical text.
Testing Micro-Interactions to Reduce Cognitive Load


“What does this animation tell you?”
“What do you expect happens next?”
“Does this icon make the topic clearer?”
These insights helped identify subtle but critical moments of confusion that would have been missed in broader usability testing.


Instead of evaluating full user flows, I focused on testing micro-decisions to uncover where users hesitated or misinterpreted visual cues.
Early testing revealed that users often perceived animations as decorative rather than functional. As a result, they struggled to understand what the motion was communicating about the system’s behavior.
To address this, I simplified motion patterns, reduced unnecessary visual noise, and introduced clearer directional cues that aligned with user expectations.
I used targeted prompts during testing to understand real-time interpretation:
As a result, users were able to interpret system behavior more accurately and required fewer clarifications when interacting with the animations.
This approach allowed me to validate not just usability, but comprehension — ensuring users didn’t just see the animation, but actually understood it.
Validating Design Decisions with Stakeholders
Each visual concept, from the hero to animations and icons, was reviewed with stakeholders and refined based on engineering feedback. Through multiple iterations, we ensured the designs remained both clear for users and technically accurate.


Collaborative Approach
This iterative validation process ensured every visual maintained engineering accuracy while remaining accessible to users. Close collaboration with technical experts allowed us to translate complex concepts into visuals stakeholders could confidently present to clients and partners.


STAKEHOLDER VALIDATION
Ensuring Accuracy Through Iterative Review Each visual concept, from hero image to animations and icons, was reviewed with the stakeholder and refined based on engineering feedback. Multiple iterations were completed to ensure both clarity and technical accuracy, resulting in visuals that were not only engaging but also engineering-approved.
From Confusion to Clarity: Validating the Final Experience
Through testing and iteration, we identified key moments of confusion and refined the experience to improve clarity, engagement, and understanding.
Before & After: User Experience Transformation
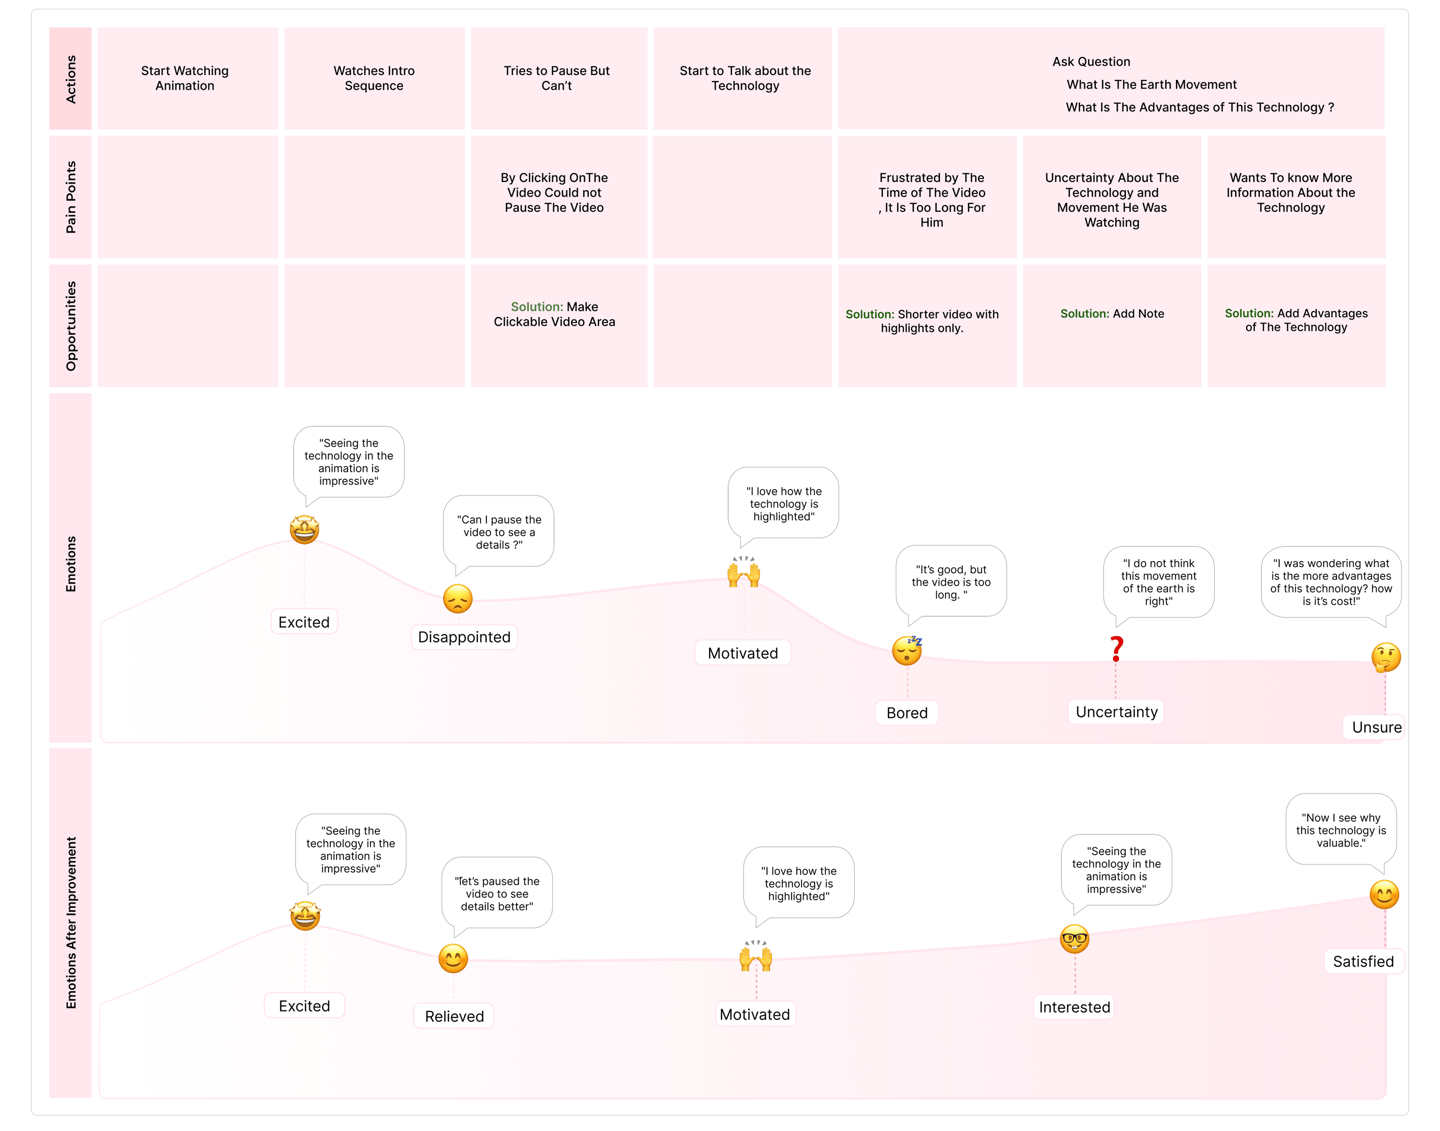
From Confusion to Clarity: Validating the Final Experience
Through iterative testing and refinement, we identified key moments where users struggled to interpret technical content particularly in understanding system behavior and navigating dense information.
By simplifying visual communication, restructuring content, and refining motion cues, the experience became significantly easier to understand and navigate.


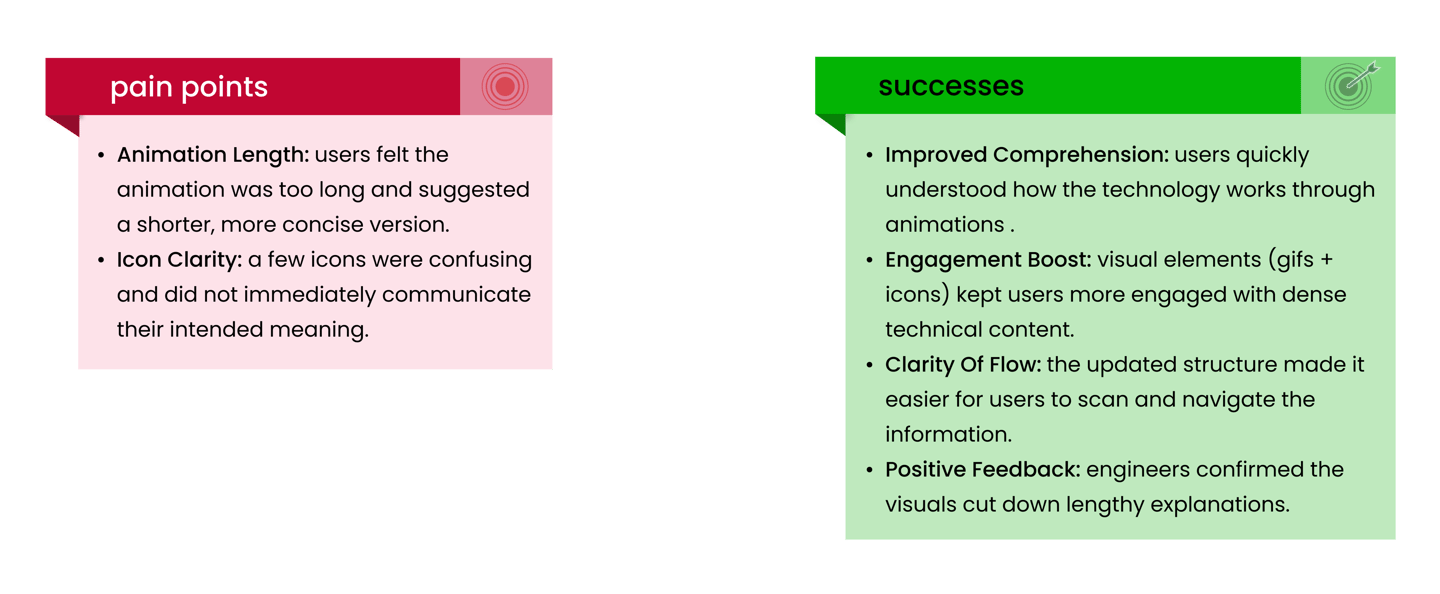
Key Outcomes
Users were able to interpret complex system behavior more quickly without requiring additional explanation
Visual structure and hierarchy reduced reliance on lengthy technical explanations
Improved clarity allowed users to navigate content with greater confidence
Stakeholders reported that the design better supports real-world communication with clients and partners
This project demonstrated that designing for complex technical systems is not just about presenting information clearly, but about shaping how users interpret, trust, and engage with that information.


Problem #3 Visualizing a Technology with No Visual Assets
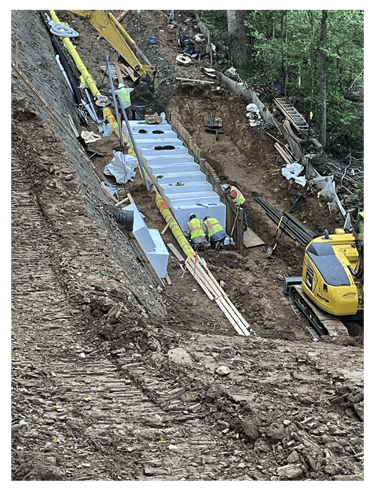
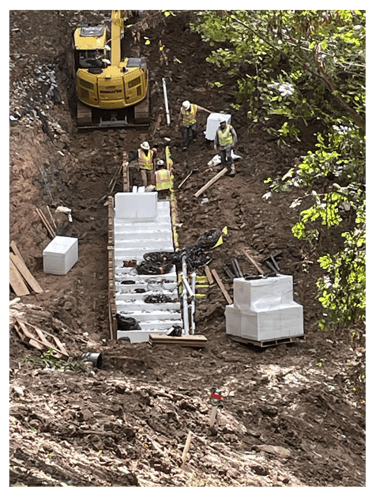
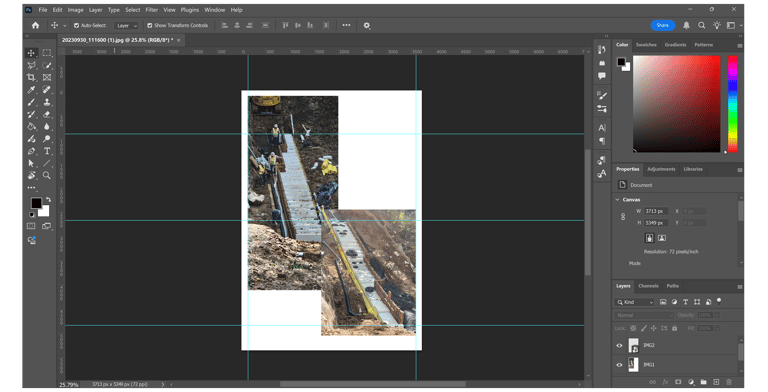
Transforming Low Quality Photos into Professional, Trust-Building Visuals
Assessing the Photo Challenge
We received a large collection of real project images from the stakeholder. While these images were valuable for authenticity, most were low in quality and inconsistent in lighting, composition, and resolution.
Using them directly would weaken the visual credibility of the website and reduce user trust.
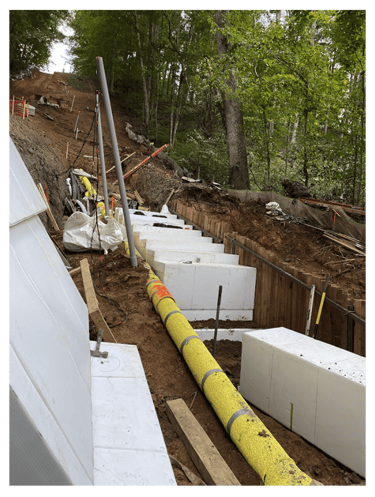
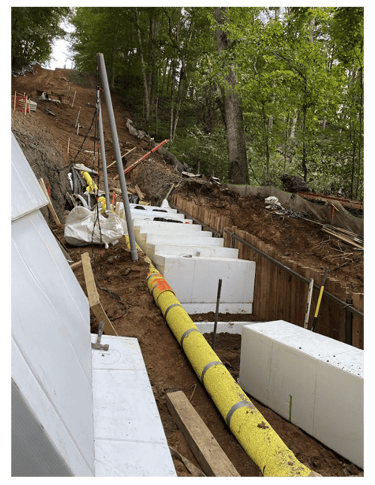
Goal: Build trust and visual credibility despite the absence of professional photography, while still clearly communicating the product.


Rather than discarding the images, we reframed them as an opportunity to emphasize authenticity while improving perceived quality through design.
Instead of relying on polished marketing visuals, we focused on enhancing, structuring, and contextualizing the images to make them feel intentional, credible, and easier to understand.
Our Approach
Enhancing Image Quality to Build Trust
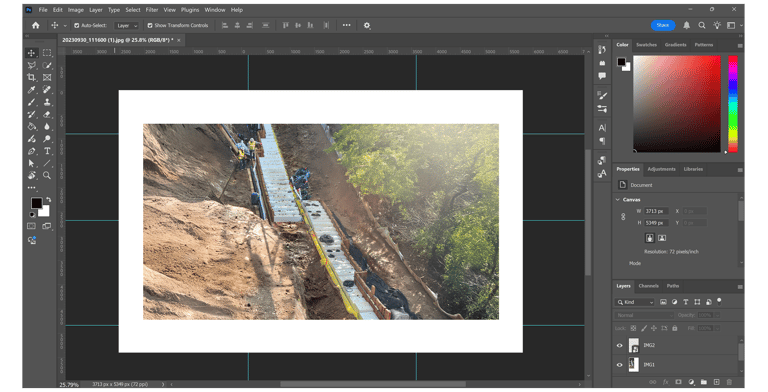
To ensure the images supported credibility rather than undermining it, we applied a structured enhancement process focused on clarity, consistency, and visual hierarchy.
Selected images based on their relevance to key user questions and technical clarity
Improved lighting, contrast, and color balance to create a more consistent visual language
Reduced visual noise and distractions to highlight the core subject
Cropped and reframed compositions to guide user attention
Enhanced key details to make the product more recognizable and trustworthy
This approach allowed us to elevate the perceived quality of the visuals without losing the authenticity of real-world project imagery.
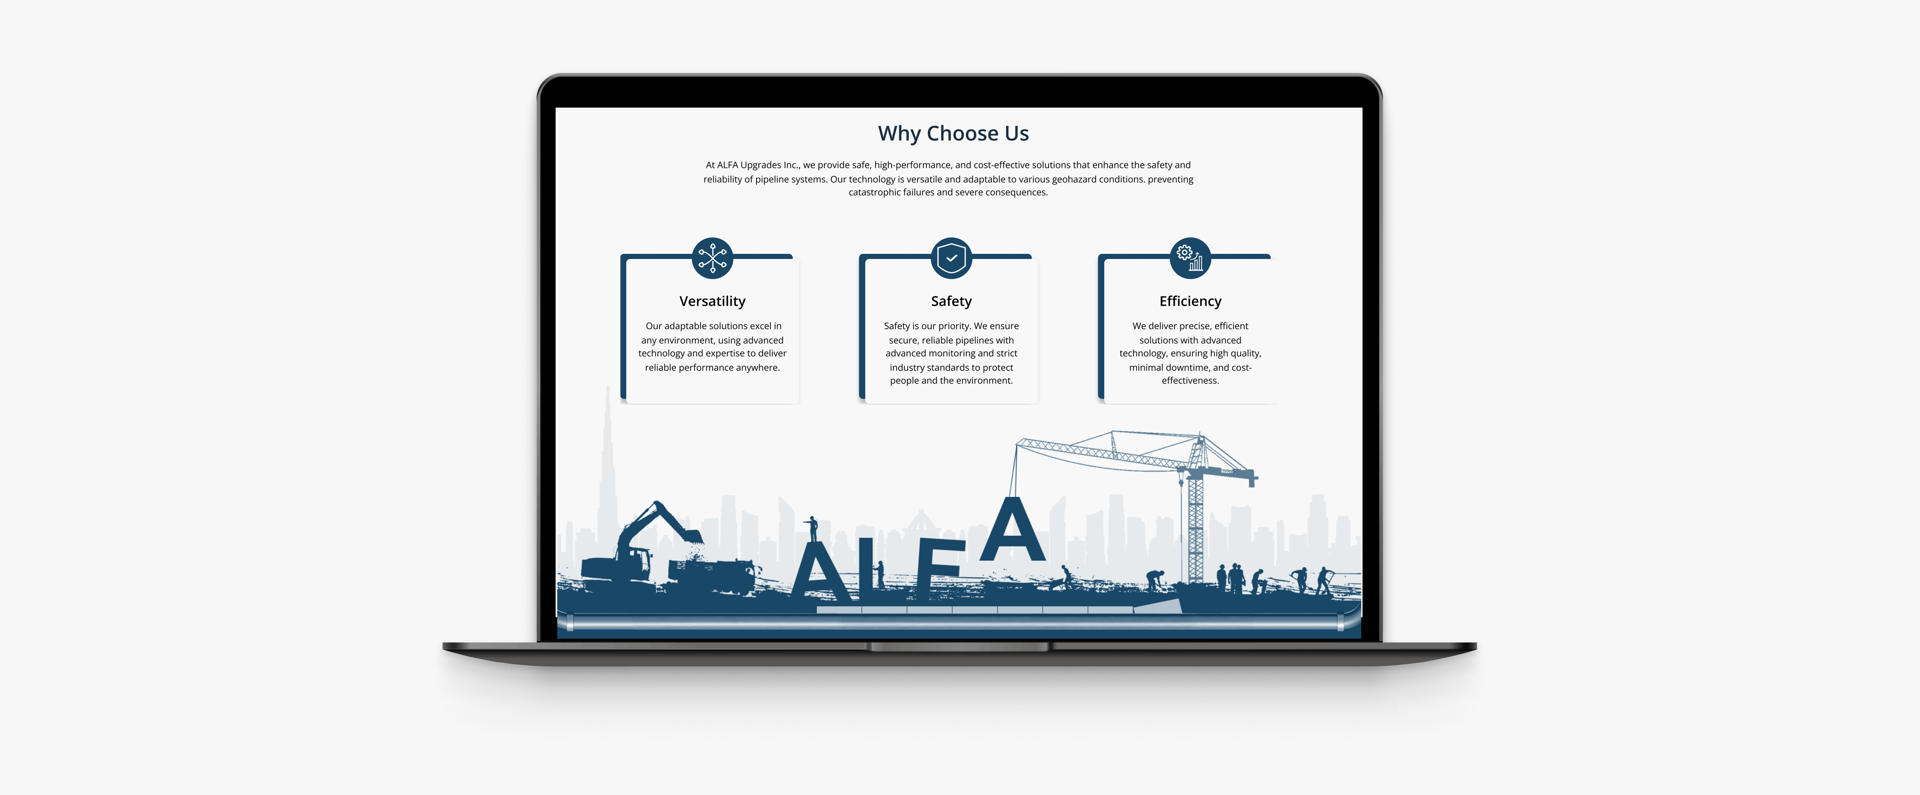
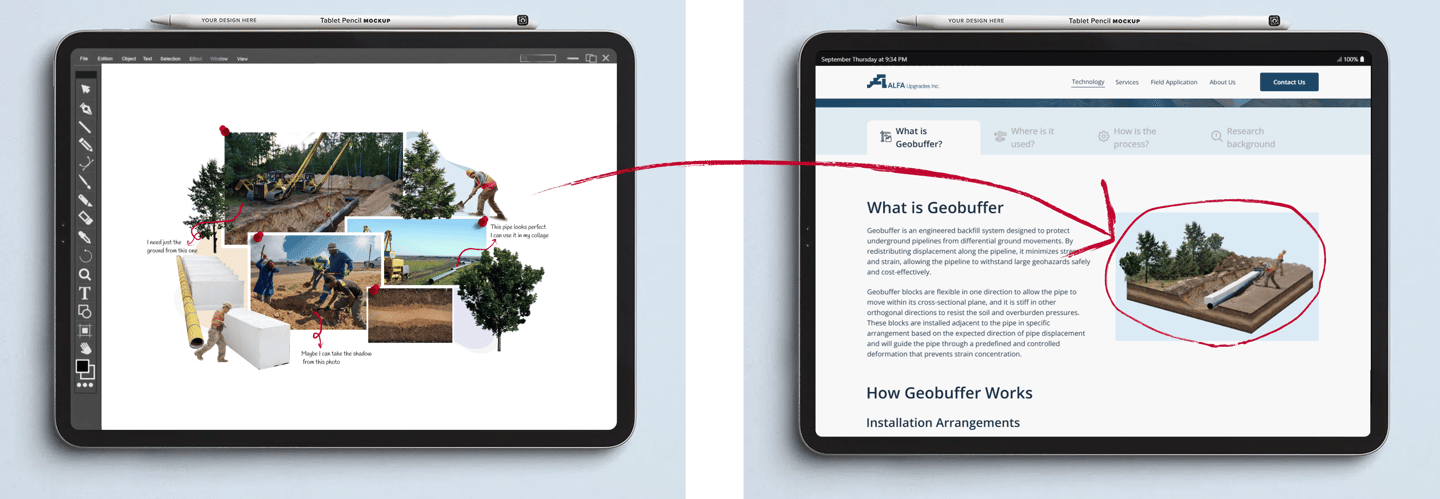
Adapting Real Images for Clear Communication
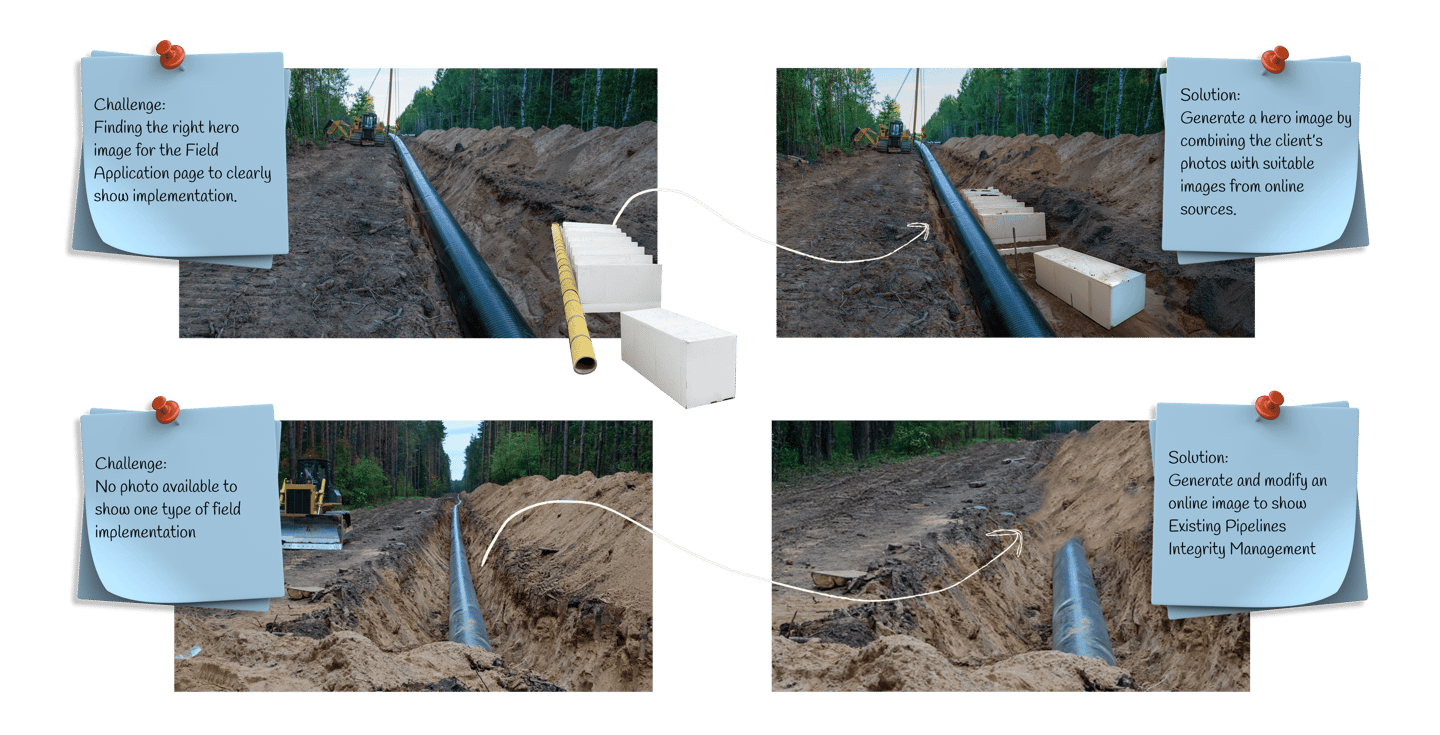
Challenge:
No image available to give the audience understanding of the technology and its implementation
Solution:
Created a collage using client photos and design techniques to provide a clear, one glance visualization of the technology
By restructuring and augmenting existing imagery, we ensured that every visual directly supported user understanding rather than acting as decoration.
Design communicates more than information, it shapes perception and trust. In this project, translating technical concepts into visual storytelling showed how color, icons, and layout can make complex systems feel understandable and credible.
Clarity emerges through iteration. Working through multiple rounds of feedback with both stakeholders and engineers helped refine the balance between technical accuracy and user comprehension.
Understanding user mindset is critical for technical products. Observing how users reacted to animations and visuals reinforced the importance of designing for both comprehension and confidence.
Small visual decisions have a measurable impact. From simplifying icons to restructuring content, each detail contributed to reducing cognitive load and improving how users interpreted the system.
Design Insights & Learnings
Overall, this project reinforced that designing for complex systems is not just about simplifying information, but about building trust through clarity, structure, and thoughtful visual communication.